Friday, January 28, 2011

Gulls, Part 1

The word “gull” probably has the ability to elicit the widest range of emotion among birders and non-birders alike of any bird name. To some birders, “gull” means woe and misery, but to others, it means joy and excitement. To the average non-birder, gulls, or “seagulls,” are a nuisance, “flying rats” that steal food at picnics and eat garbage at the dump. It's also probably one of the few groups that has some of the most sought-after rarities, along with some of the most common “trash” birds.

But, what is a gull? Gulls are part of the order Charadriiformes. Within this large, diverse order, the gulls (part of the family Laridae) are part of the suborder Lari. The Laridae is sister to the skuas/jaegers (Stercorariidae) and the auks (Alcidae). These families are in turn sister to the Crab Plover (Dromadidae) and coursers/pratincoles (Glareolidae). In the Lari, the button quail (Turnicidae) are sister to the rest of the group (Baker et al. 2007, Pereira and Baker 2010).

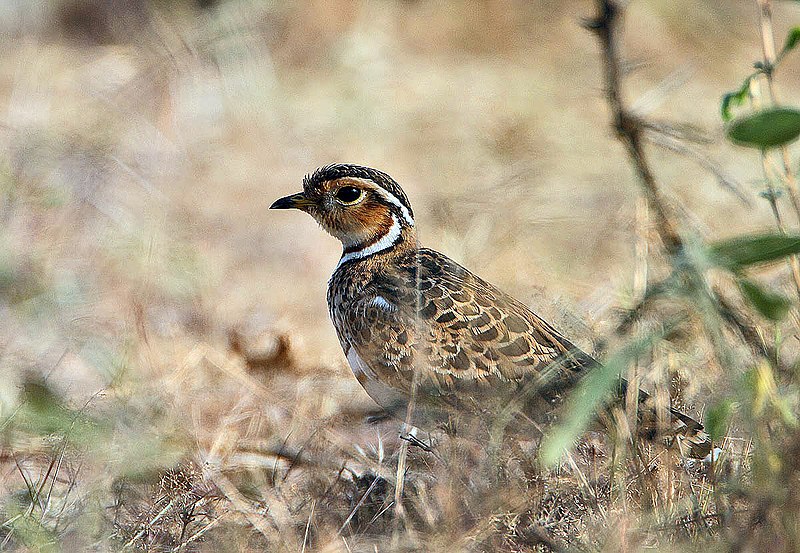
Hueglin's (Three-banded) Courser (Rhinoptilus cinctus) (Source: Wikipedia)

Within the family Laridae, the gulls are related to the terns and skimmers. While the exact relationships of the gulls relative to the terns and skimmers has not been completely resolved, a recent in depth phylogeny shows the gulls as sister to skimmers, which are in turn sister to most of the terns (Baker et al. 2007). In this study, the noddies (Anous) and white terns (Gygis) fall outside of the “tern” clade, and are sister to the entire group of gulls, terns and skimmers. Other recent studies have found conflicting results to Baker et al. (2007), instead finding the terns as sister to the skimmers, which are then in turn sister to the gulls (Fain et al. 2007), or with the gulls and terns as sister, which are then in turn sister to the skimmers (Ericson et al. 2003). In a phylogenetic study of the terns, Bridge et al. (2005) found the terns to compose a monophyletic group. However, this may not reflect the true phylogeny, as the outgroup (Ring-billed Gull) may have been forced, forcing a monophyletic Sterninae (more on tern phylogeny in another post).

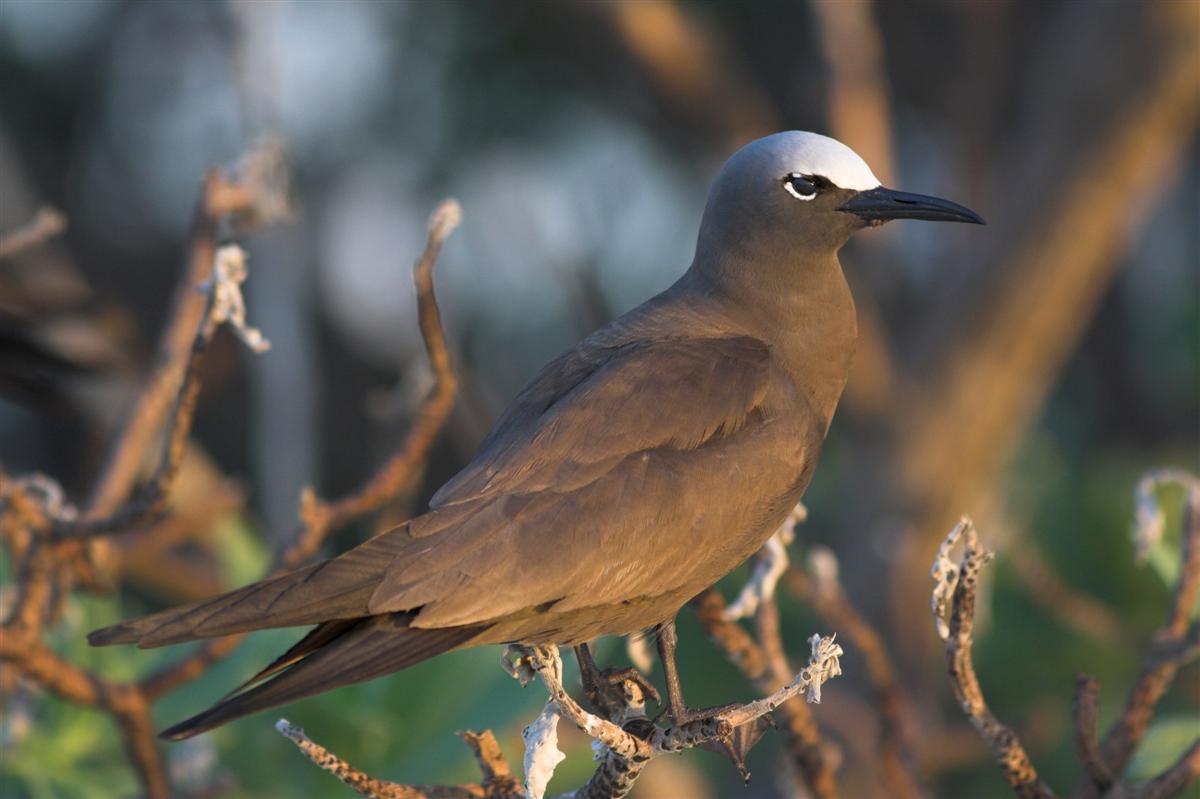
Brown Noddy (Anous stolidus) (Source: Wikipedia)

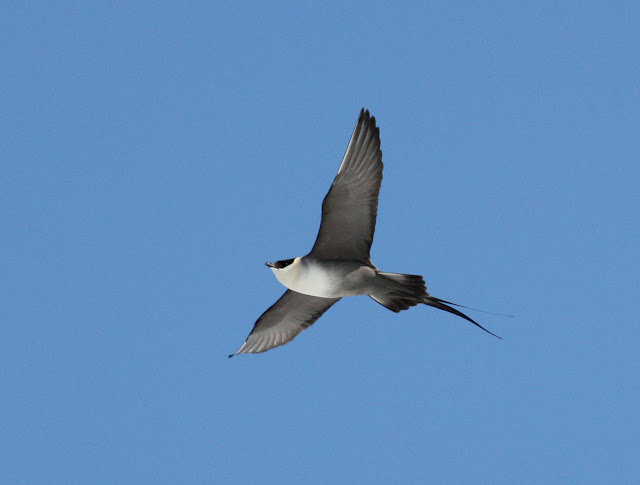
Long-tailed Jaeger (Stercorarius longicauda), June 2009, Churchill, MB (photo by Jay McGowan)

Parasitic Jaeger (Stercorarius parasiticus), July 2010, Churchill, MB (photo by Andy Johnson)

Within the Laridae, the species level relationships have not been well-resolved. However, the phylogeny been found to consist of several well-supported clades, which renders the traditional Larus (sensu lato) paraphyletic with respect to several of the long-held “unique” genera. This has left two main options, 1) place all gulls in the genus Larus, losing the long recognized unique genera of Rissa, Pagophila, Xema, and Rhodostethia, or 2) break up the traditional Larus. Based largely on the phylogeny of Pons et al. (2005), the AOU and other organizations chose the later, and split up the large and bulky genus Larus into several smaller, distinct genera.

While sampling is not extensive, Baker et al. (2007) recovered different results from Pons et al. (2005) with respect to basal relationships. Baker et al. (2007) found that the Swallow-tailed Gull was sister to Ross’s Gull, which were in turn sister to a clade that includes Sabine’s Gull, Ivory Gull, the kittiwakes, and Larus.

I’ll briefly go through the main highlights (using the “new” genera) of Pons et al. (2005), moving from most basal to most derived.

Figure 1 from Pons et al (2005) showing the phylogeny of the gulls based on mitochondrial DNA sequence data. Note the old names are used in the figure. Click on the figure to make it larger.

Swallow-tailed Gull (Creagrus furcatus) (Source: Wikipedia)

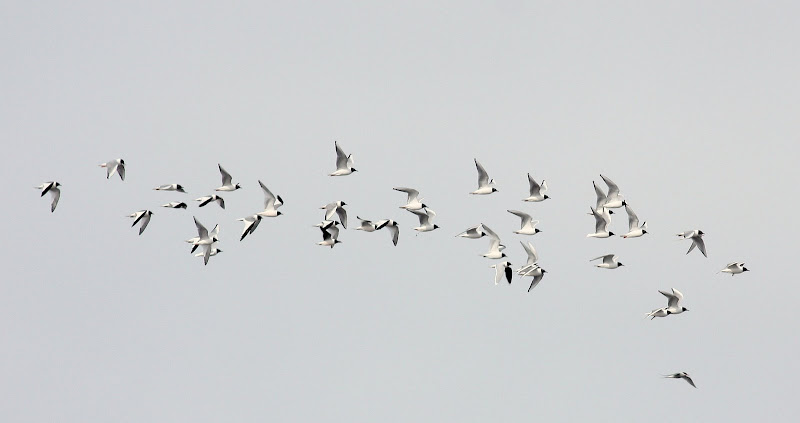
Mixed flock containing Bonaparte's Gulls (Chroicocephalus philadelphia), Sabine's Gulls (Xema sabini), and Little Gulls (Hydrocoloeus minuta), June 2009, Churchill, MB (photo by Jay McGowan)

Mixed flock, including Brown-hooded Gulls (Chroicocephalus maculipennis), Franklin's Gulls (Leucophaeus pipixcan), and Kelp Gulls, January 2010, Chiloe, Chile (Larus dominicanus)

Ross's Gull (Rhodostethia rosea), with a Bonaparte's Gull, June 2008, Churchill, MB (photo by Jay McGowan)

  1. Creagrus – 1 species, Swallow-tailed Gull (C. furcatus), endemic to the Galapagos. A truly unique gull, and partly nocturnal, it spends much of its time far from land. The Swallow-tailed Gull has been found to be sister to the rest of the gulls.
  2. Rissa – 2 species, Red-legged (R. brevirostris) and Black-legged Kittiwakes (R. tridactyla). Both species are colonial nesters, nesting along cliff and rock ledges. The Black-legged Kittiwake is widespread, while the Red-legged Kittiwake is restricted to the Bering Sea. Both are largely pelagic during the non-breeding period. The two kittiwakes are sister-species and are in turn sister to two other species, the Sabine's Gull (Xema sabini) and Ivory Gull (Pagophila eburnea)
  3. Xema – 1 species, Sabine’s Gull (X. sabini), a gull breeding in the arctic and sub-arctic, and spending the non-breeding period far from shore. A striking gull, it’s forked tail and bold wing pattern make it stunning bird in all plumages. The Sabine's Gull is sister to the Ivory Gull.
  4. Pagophila – 1 species, Ivory Gull (P. eburnea), a gull that spends nearly its entire life in the arctic and along the edges of the pack ice of the far north, this beautiful species is a much sought after species of southern latitudes, and may be suffering due to changes to its Arctic habitat due to global climate change. The Ivory Gull is sister to the Sabine's Gull, which are in turn sister to the kittiwakes.
  5. Chroicocephalus – 11 species. This is a well-supported clade of relatively small, mostly hooded gulls. The North American boreal breeder, Bonaparte’s Gull (C. philadelphia) is sister to Slender-billed Gull (C. genei). These two species are sister to the rest of the genus. The remaining Chroicocephalus form a weakly-supported clade, to which Andean Gull (C. serranus) is basal. The Brown-hooded Gull (C. maculipennis) is sister to the remaining members of the clade. Within this clade, Hartlaub’s Gull (C. hartlaubii) is sister to Grey-hooded Gull (C. cirrocephalus). These two species are sister to Black-headed Gull (C. ridibundus) and (C. brunnicephalus). These four species are in turn sister to a group of three Australasian gulls, with Black-billed Gull (C. bulleri) being most closely related to the Red-billed Gull (C. scopulinus) and Silver Gull (C. novaehollandiae).
  6. Saundersilarus – 1 species, the Saunder’s Gull (S. saundersi), is found only in East Asia, where it is threatened with habitat destruction. This species is not closely related to any other gull, and its relative position in the phylogeny is not well-resolved, possibly due to its long branch on the tree.
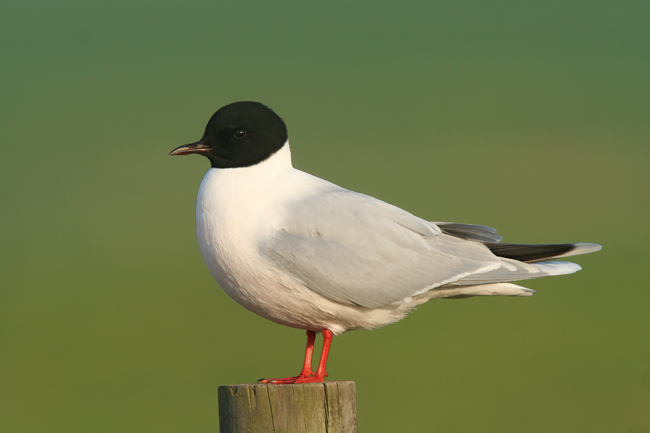
  7. Rhodostethia – 1 species, the Ross’s Gull (R. rosea), is a breeder in Arctic Russia, Canada, and Greenland, is a sought after bird when it ventures to southern latitudes. This species put Churchill, Manitoba on the map in terms of birding, as the most accessible location in the world to see this bird on its breeding grounds. While no longer reliable (seen in June 2008 once, and not at all in 2009 or 2010 while I was in Churchill), many people still travel there every June hoping to see this beautiful gull. Pons et al. (2005) proposed to lump Rhodostethia into Hydrocoloeus based on strong genetic and morphological support. While it has been accepted that Ross’s and Little Gulls are sister species, the AOU chose to retain Ross’s Gull in its own monophyletic genus. The Ross's Gull is sister to the Little Gull. However, the relative position of these two species with respect to the rest of the phylogeny of gulls is not well-supported.
  8. Hydrocoloeus – 1 species, the Little Gull (H. minutus), is fairly widespread in Eurasia, and breeds in small pockets in North America. This bird is sister to Ross’s Gull (Rhodostethia rosea), and shares a suite of morphological and behavioral characters.
  9. Leucophaeus – 5 species; an entirely New World group of gulls. This clade appears to be sister to the remaining two genera of gulls, the Ichthyaetus and Larus. Within the genus, the Grey Gull (L. modestus) is sister to the bizarre and intriguing Dolphin Gull (L. scoresbii). These two South American species are sister to the remaining three species, with Franklin’s Gull (L. pipixcan) being most closely related to the Lava Gull (L. fuliginosus) of the Galapagos, which are in turn sister to the Laughing Gull (L. atricilla).
  10. Ichthyaetus – 6 species; an entirely Old World radiation of gulls. This clade is sister to the large and confusingly specious Larus. None of the relationships within this group are well resolved. The topography within Pons et al. (2005) places the Mediterranean Gull (I. melanocephalus) as sister to the rest of the genus, which includes Audouin’s Gull (I. audouinii), Relict Gull (I. relictus), White-eyed Gull (I. leucophthalmus), Great Black-headed Gull (I. ichthyaetus), and Sooty Gull (I. hemprichii).
  11. Larus - the rest... the dreaded “large, white-headed” gulls (LWHG) of the genus Larus. Within the genus Larus, the “black-tailed” gulls, which includes Belcher’s Gull (L. belcheri) and Black-tailed Gull (L. crassirostris), form a distinct clade that is sister to the remaining LWHG. The rest of the juicy details about this messy genus will be coming in later posts.
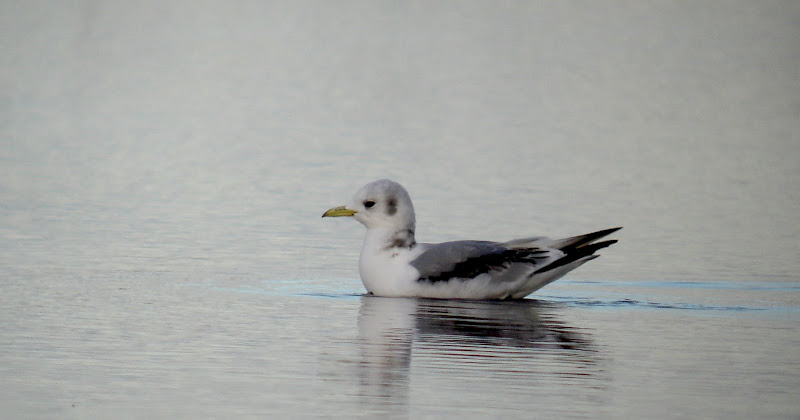
Black-legged Kittiwake (Rissa tridactyla), June 2008, Churchill, MB (photo by Jay McGowan)

Ivory Gull, February 2010, Rouses Point, NY (Pagophila eburnea)

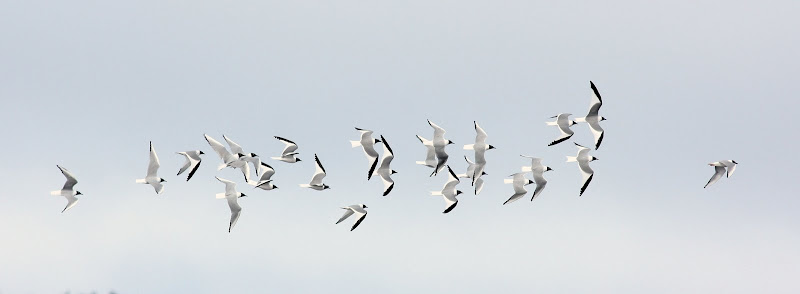
Mixed flock containing Bonaparte's Gulls (Chroicocephalus philadelphia) and Sabine's Gulls (Xema sabini), June 2009, Churchill, MB (photo by Jay McGowan)

Mediterranean Gull (Ichthyaetus melanocephalus) (Source: Wikipedia)

And, finally, here is a taste of what is to come...

Heermann's Gull (Larus heermanni), September 2009, Pacifica, CA

Thayer's Gulls (Larus thayeri), June 2009, Churchill, MB (see this post for more on these Thayer's Gulls and other gulls of Churchill)

Glaucous Gull (Larus hyperboreus), with Herring Gulls (Larus argentatus), June 2009, Churchill, MB

References:

Baker, A.J., S.L. Pereira, T.A. Paton. 2007. Phylogenetic relationships and divergence times of Charadriiformes genera: multigene evidence for the Cretaceous origin of at least 14 clades of shorebirds. Biology Letters 3: 205-207

Bridge, E.S., A.W. Jones, A.J. Baker. 2005. A phylogenetic framework for the terns (Sternini) inferred from mtDNA sequences: implications for taxonomy and plumage evolution. Molecular Phylogenetics and Evolution 35: 459-469

Ericson, P.G.P., I. Envall, M. Irestedt, J.A. Norman. 2003. Inter-familial relationships of the shorebirds (Aves: Charadriiformes) based on nuclear DNA sequence data. BMC Evolutionary Biology 3(16)

Fain, M.G. and P. Houde. 2007. Multilocus perspectives on the monophyly and phylogeny of the order Charadriiformes (Aves). BMC Evolutionary Biology 7(35)

Pereira, S.L and A.J. Baker. 2010. The enigmatic monotypic crab plover Dromas ardeola is closely related to pratincoles and coursers (Aves, Charadriiformes, Glareolidae). Genetics and Molecular Biology 33(3) 583-586

Pons, J.M., A. Hassani, P.A. Crochet. 2005. Phylogenetic relationships within the Laridae (Charadriiformes: Aves) inferred from mitochondria markers. Molecular Phylogenetics and Evolution 37: 686-699

Thursday, December 23, 2010

What is that annoying buzzing sound?

After a period of dormancy on the blog, I finally have a little bit of time to write a few more posts. This is one of the last of the Churchill posts, and hopefully soon I'll be able to write about some new topics.

No recount of fieldwork in Churchill, Manitoba can be complete without some horror story of the bugs. While I was lucky during the 2009 season with abnormally cool temperatures, no such luck was had during the 2010 season. The mosquito density was just unreal. No amount of bug spray can protect you... I've been told that insect repellent does make a dent in the mosquitoes trying to bite you... instead of 5,000 mosquitoes trying to bite you, bug spray makes it so that a mere 3,000 are attacking you. In the end, the people who work in Churchill just don't find poisoning themselves with bug spray worth it. On the bright side, there are no diseases that mosquitoes carry in the far north!

During field work, we would have to be completely covered from head to toe. This involved wearing head nets, long sleeves, and, most importantly, gloves. Thin gloves were essential, especially when we had to take field notes. In addition, when dealing with blackflies, it was extremely important to tuck pants into socks, gloves into sleeves, and shirts into pants, since blackflies crawl into tight spaces and will find their way into the tiniest hole to bite you. When all covered and prepared, I usually avoided mosquito bites in the field completely. I usually ended up getting more bites in the Study Centre or in the car.

Now, words can only do so much to describe the bug density. For the rest, I will let my pictures show the horror.

A large flock of mosquitoes.

Gloves are important.

Mosquito carnage. In the top image, I got 72 in one swat of my hand. I can't remember how many we got in our field notebook, but it was well over 100.

Yours truly, doing veg surveys, with a small cloud of mosquitoes around my head.

A truly scary cloud of mosquitoes. Click on the image to zoom in to see all the mosquitoes that are a bit farther away.

The next few photos are from Jay McGowan, who I spent 2009 field season with. His pictures truly capture the insect abundance.

Mosquitoes like dark colors. Zoom in on this picture to see how many are really there. It's unreal. (photo by Jay McGowan)

I think this may be one of the signs of the Apocalypse... "and the Lord sent forth a cloud, and the sky was darkened with mosquito" (photo by Jay McGowan)

The following video is from the 2010 field season on one of the more buggy nights. Listen with sound...


Tuesday, December 14, 2010

Bird species discovery odds and ends

Here are a couple more neat graphs about the rate of discovery of new bird species that I couldn't fit well into my previous two posts about the subject (10,000 birds? Part 1 and Part 2).

In Part 1 I briefly introduced the species accumulation curve as a means of comparison of rates of discovery between different groups. Here, I wanted to parse apart any broad-scale patterns in the bird data. I started by splitting the birds into their two broadest groupings - passerines (5927 species) and non-passerines (4100 species) - and then I split passerines again into two more broad classes - oscines (4668 species) and suboscines (1259 species). These new species accumulation curves are plotted against the overall bird curve (in black):


(click to enlarge)

The non-passerine curve falls generally to the left of the passerines and birds overall, indicating that non-passerines were generally described earlier than passerines and fewer non-passerines have remained undescribed until recently. The passerine, oscine, and suboscine curves are generally similar in slope and position, although suboscines lag in the last 100 years or so. The suboscine curve is also the only one with a noticeable uptick - a bunch of new species described - in the last few decades.

Those who know me when I get into projects like this know I like to take things to ridiculous excess. In this case, I decided to investigate family-level patterns of description. To get fairly smooth accumulation curves requires a fairly large number of taxa, so I picked the bird families recognized by Birdlife that contain more than 150 species. These twenty families are:

Family name Species
Tyrannidae 414
Psittacidae 374
Trochilidae 337
Timaliidae 326
Columbidae 318
Emberizidae 313
Sylviidae 293
Muscicapidae 286
Thraupidae 256
Furnariidae 241
Accipitridae 238
Picidae 218
Thamnophilidae 218
Strigidae 186
Phasianidae 181
Meliphagidae 177
Fringillidae 177
Turdidae 173
Anatidae 164
Rallidae 156

And their species accumulation curves, plotted against the all-bird curve in black:

(click to enlarge)

I don't expect anyone to actually tease apart that rainbow coalition of squiggles in detail, especially because they form such a tight column of similarly-sloped curves. That in itself is a pretty neat result - the family-level differences aren't as noticeable as I thought they would be, and teasing them apart in detail is fairly pointless. There are, however, two curves that stand apart from the rest.

On the far left in pale blue is Anatidae. 50% of the currently known ducks were described by 1800, decades before any other family, and 90% were described by 1870. Ducks are big, obvious birds with common interaction with humans (in the form of hunting) and often bold, distinct male plumages in each species. It is thus not surprising that ducks were described comparatively early in history and very few new species have been described in the last 100 years.

In contrast, on the right side of the curves, the pale reddish curve for Strigidae falls below the others in the last 100 years or so. The slope is pretty similar to the other curves for this time period, so I don't think the overall rate of discovery in owls is much lower. Instead, the curve is displaced lower by the flush of new species described in the last few decades - remember in my last post that owls had the highest number of new species described of any family since 1942.

That's all I have for now - have fun staring at those colorful squiggles.

Monday, December 13, 2010

10000 birds? Part 2

In Part 1, I looked at the history of bird species discovery, and found that new bird species have been described at a fairly steady rate of an average 4.9 species per year since the 1940s. Here, I'll review what species have been discovered since the 1940s, where they are found, and why it took so long to find them.

From 1942 until 2008, 330 species encompassing 76 families and 213 genera were described:


(note: I accidently included 1 2009 datapoint, but 2009 is incomplete and more than 1 were described that year)

Among the top families, five (Tyrannidae - tyrant flycatchers, Thamnophilidae -antbirds, Furnariidae - ovenbirds, Rhinocryptidae - tapaculos, Formicariidae - anthrushs) represent the diverse suboscine lineages of South America. Two other top families (Sylviidae - old world warbles and Timaliidae - babblers) are similarly diverse lineages from the old world (I don't think Birdlife carves up these families into smaller groups as other checklists do in the last few years). My gut impression before seeing this data was that these two broad groups of birds would be the leaders for multiple reasons - they compose many of the species I could remember seeing described in the last few years, they contain many cryptic groups and are receiving active taxonomic treatment with new input from DNA and song, and they are found in the tropical areas of the world still receiving new exploration and documentation of fauna. However, the winner in the family category by a large margin was a surprise for me: Strigidae (owls). It makes sense that cryptic nocturnal birds would contain a lot of previously undocumented diversity, but I was surprised at the scale. The top genera track the top families as expected (Glaucidium - Pygmy-Owls, Otus - Scops-Owls, Scytalopus - Tapaculos, Grallaria - Antpittas, Phylloscartes - Tyrannulets, etc).

There are a myriad of historical and unquantifiable reasons that bird species persist until the present day undiscovered or unrecognized by science. However, I made several simple, straightforward predictions about recently discovered species that can be quantified and tested:

1) New species are likely to be found in underexplored tropical countries
2) New species are likely to be single-country endemics
3) New species are likely to have small ranges
4) New species are likely to have small populations and thus more likely to be endangered

Using Birdlife International's online database, I was able to extract relevant bits of information regarding these new species - where they are found, whether they are country endemics, their estimated range size, and their Birdlife conservation status. I tested my predictions by comparing the species described from 1942-2008 with random samples of species described earlier in history: 100 species described by Linnaeus in 1758 and 200 described in the 1840's-1860's.

1) New species are likely to be found in underexplored tropical countries

Here is a summary of where the new species (1942-2008) are found. The first column is overall country listings, which sums to well over 330 because of species ranging across many countries. The second column of results is for single-country endemic species.


As expected, the South American and Southeast Asian tropics top both lists, with Peru and Brazil leading both categories by a good margin.

2) New species are likely to be single-country endemics

I didn't tally the country-by-country data for my 1758 and 1800's sample groups, because so many of them span a huge range of countries. This difference is apparent when you compare the proportion of single-country endemics for each category:

6% of species described in 1758 are found in a single country
24% of species described in the 1840s-1860s are found in a single country
72% of species describe 1942-2008 are found within a single country

This confirms that recently described species are more likely to be restricted to within a single country, and are thus easier to overlook, than those species described earlier in history.

3) New species are likely to have small ranges

I binned the Birdlife range size data by order of magnitude for each of the three time periods and calculated the proportion of the sample in each:

(click to enlarge)

The species described by Linnaeus in 1758 (blue bars) are overwhelmingly species with huge ranges in the millions of square kilometers. Species described in the mid-1800's still have ranges mostly in the hundreds of thousands to millions of square kilometers, but there is a wider distribution of species among the size classes.

For new species described 1942-2008, the distribution among size classes is much wider than in the other time periods. Less than 4% of these species have ranges in the millions of square kilometers - these include species like Cryptic Forest Falcon (Micrastur mintoni) and Amazonian Pygmy-Owl (Glaucidium hardyi) which have large Amazonian ranges. The largest proportion of new species have ranges sizes that are fairly small - 1000s to tens of thousands of square kilometers.

The most stunning category is for range sizes of less than 100 square kilometers - an area only 5 times bigger than my hometown of North Tonawanda, NY. 12.5% of new species (32 total) fall into this category, with some absurdly small known ranges. Four species have a known range of less than ten square kilometers - Munchique Wood-Wren (Henicorhina negreti, 8 sq. km), Poo-uli (Melamprosops phaeosoma, 3 sq. km), Calayan Rail (Gallirallus calayanensis, 2 sq. km), and Bugun Liocichla (Liocichla bugunorum, 2 sq. km). Words fail me in trying to describe how mind-boggling, fascinating yet even heart-breaking it is to see species with ranges like this. The only species with ranges this small in the other categories are a fruit-dove and a honeyeater described in the mid 1800s from tiny South Pacific islands with range sizes around 25-50 sq. km.

4) New species are likely to have small populations and thus are more likely to be endangered

I wasn't able to easily pull data on population sizes for a large range of species from the Birdlife database, so instead I used a proxy - Birdlife conservation status. I calculated the proportion of species from each time period that fall into the six Birdlife categories:

DD = Data Deficient
LC = Least Concern
NT = Near Threatened
VU = Vulnerable
EN = Endangered
CR = Critically Endangered

(click to enlarge)

Just as the 1758 and mid-1800s samples were overwhelming skewed towards species with large range sizes, these categories are both over 80% composed of species ranked Least Concern. Only one of the 1758 species (Bald Ibis, Geronticus eremita) and one of the 1800s species (Cuban Kite, Chondrohierax wilsonii) are recognized as Critically Endangered. A plurality of the new species are Least Concern, but there is a very wide distribution of rankings, with 8.5% (28 species) being Critically Endangered.


Well, that about covers it. If you weren't keeping a running tally, all of my predictions were validated by the data! While I love playing with this data and learning more about the patterns of discovery of new species, I realized in the end that these findings are rather disturbing. A depressingly large proportion of bird species that have remained unknown to science until recently have very tiny ranges and are endangered. In this era of exceptional environmental destruction, how many more species like these have slipped away into extinction unnoticed? That is a number we can never know.

Sunday, December 12, 2010

10,000 Birds?

"You think you know every bird in the world, and then someone shows you a Curl-crested Aracari"
David Quammen, The Song of the Dodo

An oft-cited figure for the diversity of birds in the world is around 10,000 living species, a reasonable rule of thumb although estimates vary - Birdlife International currently recognizes 10,027 while the IOC list is currently at 10,396. Duncan Wright says the number should be closer to 12,000 if recently extinct birds are included (and he also coincidentally begins with a David Quammen quote). Pinning down an exact number is an impossibility because differing opinions on species limits in species and subspecies complexes create a near-infinite number of list permutations. Pinning down a number is also impossible because the bar keeps getting raised by the new bird species discovered every year.

New species of bird often receive a small splash of press when discovered or described, because birds are regarded as an exceptionally well described group of vertebrates and we've long reached the point where new birds are few in number. Additionally, the hunt for new species has been romanticized in such good reads as A Parrot Without A Name or this more recent Birding article (pdf) by Joseph Tobias. Tobias quotes Mayr (1946) as proclaiming the general end of new bird discovery - “I doubt that in the entire world even as many as 100 new species remain to be discovered” - but states that a yearly trickle of new species have been described since then. Just how many new birds are discovered every year? How much has the trickle of new birds declined? How many new birds are left to discover?

I can't answer the last question, but I can find data for the first two. It is a logistical nightmare to track down this data by finding every new species description in the primary literature. Instead, I picked a world checklist to find what I needed. The formal way to list species in literature includes a citation for the description of the species, such as Puffinus griseus (Gmelin 1789). By using these dates, you can quickly extract the year by year data for species descriptions. This method also only counts newly described species, not splits through the elevation of previously recognized subspecies.

The only quickly downloadable checklist I found with data like this is Birdlife International's checklist, so I used their most recent version (v3, June 2010) and plotted out the data. Here is the number of new bird species described each year, beginning in 1758 with Linnaeus and ending in 2008 (the Birdlife checklist is incomplete for new species in 2009 and 2010):

(click to enlarge)

The early decades show relative inactivity in bird taxonomy punctuated by massive monographs (like the 400+ that Linnaeus described in one work). The golden age of bird taxonomy peaks in the mid-1800's, with several decades of 50+ species described every year. The number of new birds described then generally declines to the present day.

Another way to present this data - the most useful for comparison - is to create a species accumulation curve. This represents, for each year, what percentage of the total number of known species was described at that point. This allows you to examine what those small numbers of new species each year mean in the context of the total number of known bird species. The slope of the curve is a proxy for the rate of discovery of new species, and you can easily eyeball the differences in slope representing different rates of species description over time.

Here is the species accumulation curve for birds:

(click to enlarge)

This represents a typical curve for a well-described fauna - the middle range is steepest, and the curve plateaus as new species become increasing hard to find. Compare the curve for birds with that of a very different fauna, another favorite of mine, geckos:

(click to enlarge)

In stark contrast to birds, the rate of discovery of geckos has only accelerated through time, and the last few years have seen the highest yearly rates of gecko discovery ever - but that's another post. The point is that geckos are a representative of an under-described group with lots of new species to be found and taxonomic description left to be done. Birds are comparatively well-described and have relatively little left to be found.

We can estimate how little is left to be found by studying the decline in new species found. So how about that decline? Zooming in to the last 120 years, we get this:

(click to enlarge)

At about the time Mayr proclaimed the end of bird discovery in the 1940s, the overall rate of description of new birds had been trending steeply downward for decades. After the rate reached rock bottom - 1941 is the last year with more than ten bird species described - there is indeed a steady trickle of new species every year, averaging 4.9 species per year and varying from zero (in 1954 and 1978) to ten (1960, 1974, 1997) new birds yearly.

However, this trickle does not seem to show any sign of stopping, even decades after Mayr's prediction. In fact, if you take just the data from 1942-2008, look at the general trend line:

(click to enlarge)

That's right, that is a (very weakly supported) POSITIVE trend line for the discovery of new species in the last seven decades. Given the overall wide variance in discovery from year to year in these decades, I double-checked this trend my making a moving ten-year average of new birds per year:

(click to enlarge)

This is a really fascinating result! Despite the fact that the overall description rate of birds has plummeted and won't ever get back up to the rate it was 100 years ago, discovery of new birds has stabilized and shows no signs of slowing since the 1940's. That means that, while the species accumulation curve has plateaued, it is not exactly drifting towards zero and the total number of remaining bird species can't be extrapolated. Who knows what is left to find?

In part 2 of this post, I'll outline what new species have been discovered in the last few decades, where they are being found, and some reasons for their late discovery. Stay tuned.